DISCLAIMER: This note is intended for US recipients only and, in particular, is not directed at, nor intended to be relied upon by any UK recipients. Any information or analysis in this note is not an offer to sell or the solicitation of an offer to buy any securities. Nothing in this note is intended to be investment advice and nor should it be relied upon to make investment decisions. Cestrian Capital Research, Inc., its employees, agents or affiliates, including the author of this note, or related persons, may have a position in any stocks, security, or financial instrument referenced in this note. Any opinions, analyses, or probabilities expressed in this note are those of the author as of the note's date of publication and are subject to change without notice. Companies referenced in this note or their employees or affiliates may be customers of Cestrian Capital Research, Inc. Cestrian Capital Research, Inc. values both its independence and transparency and does not believe that this presents a material potential conflict of interest or impacts the content of its research or publications.
Not Over Till Its Over
by Alex King
The selloff - it can barely be called that - in recent days can be ex post facto explained by market nervousness over the fate of NVDA earnings, which is to say whether AI be real or some kind of trickery. But in truth, equities are extended on most any short-term chart measure and were due a breather. NVDA duly printed a strong quarter (you can see our video analysis of their quarter, here) and right now the market is back on the up.
That said, let’s not get ahead of ourselves. In particular let’s look to the close today and tomorrow at NVDA; during regular trading hours is when we will see the impact of NVDA options positioning - options do not trade in post- or pre-market sessions which can mean a liquid stock like NVDA can roam a little more freely than normal during those periods. The New York close is an important yardstick.
Our usual charts follow. Equities still look extended. I personally sit heavily net long but I am wary of a pullback and if one comes along I will add short hedges in the usual way - as always, paying members of our Inner Circle service receive real-time trade alerts before any such trades are placed.
For now? Scroll down for our take on the S&P500, the Nasdaq-100, the Dow Jones 30 and the Russell 2000.
Note - to open full-page versions of these charts, just click on the chart headings, which are hyperlinks.
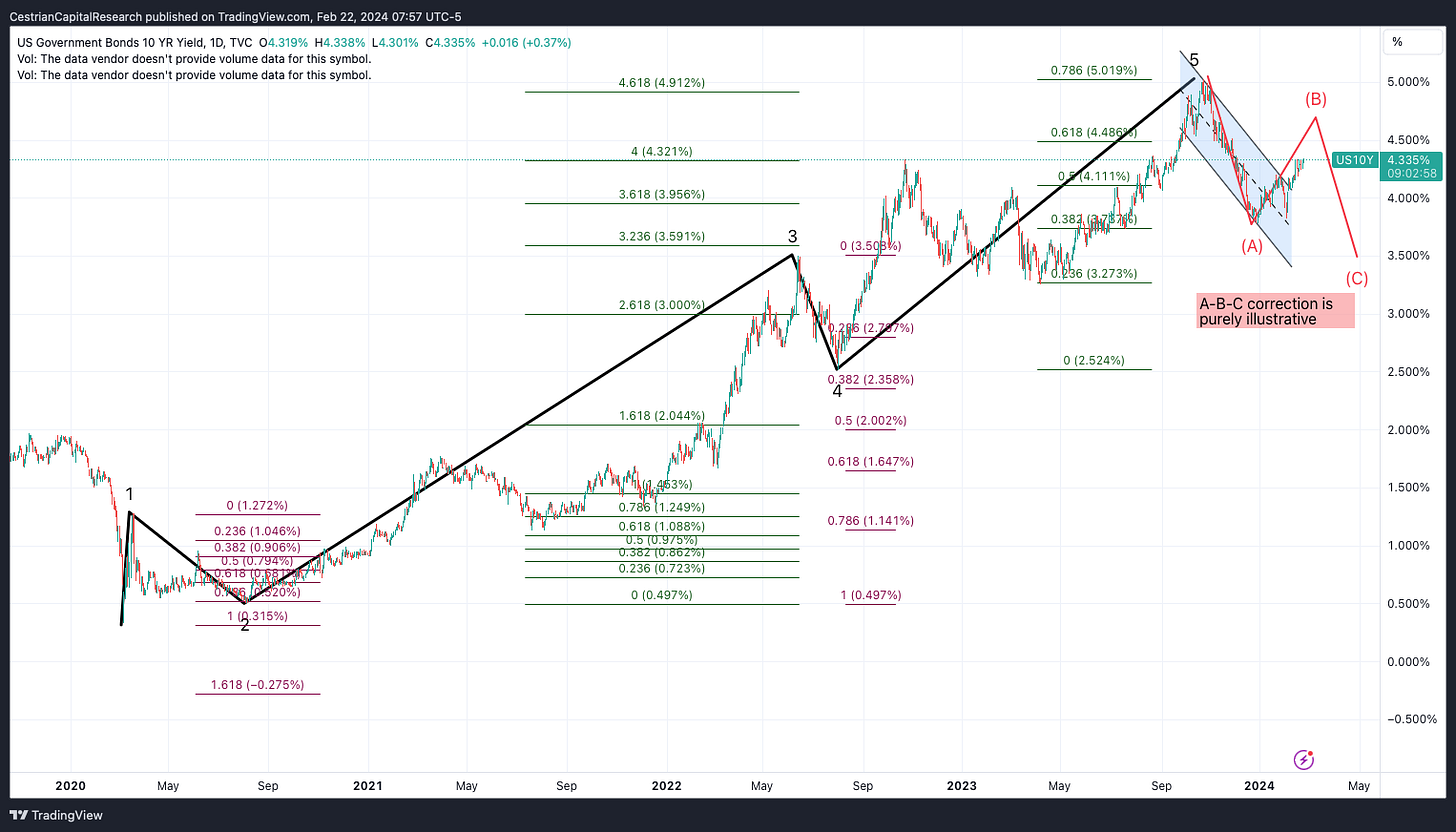
US 10-Year Yield
Still climbing towards what I believe will be a B-wave high before a C-wave move down.
S&P500 / SPY / ES / UPRO
In the medium term the S&P looks like it has plenty of room to run - to SPY533 at least in my view. Shorter term it looks extended. What you do or don’t do about this depends entirely on your timeframe of interest.


