


Indulge The Hangover, Or Keep Drinking?
This is the market's major challenge for the day!

DISCLAIMER: This note is intended for US recipients only and, in particular, is not directed at, nor intended to be relied upon by any UK recipients. Any information or analysis in this note is not an offer to sell or the solicitation of an offer to buy any securities. Nothing in this note is intended to be investment advice and nor should it be relied upon to make investment decisions. Cestrian Capital Research, Inc., its employees, agents or affiliates, including the author of this note, or related persons, may have a position in any stocks, security, or financial instrument referenced in this note. Any opinions, analyses, or probabilities expressed in this note are those of the author as of the note's date of publication and are subject to change without notice. Companies referenced in this note or their employees or affiliates may be customers of Cestrian Capital Research, Inc. Cestrian Capital Research, Inc. values both its independence and transparency and does not believe that this presents a material potential conflict of interest or impacts the content of its research or publications.
Now What?
All four US equity indices put in a blowout week last week. In each case technically they have made a new Wave 1 up from the October lows; this means at some point we will see a Wave 2 correction, possibly a sharp one, which it would be good to catch on the short side then commit further to longs at the Wave 2 lows.
This is what the indices looked like in the smaller degree at the close of Friday last week - here we show hourly charts to illustrate the extent of last week's move and therefore the precipitous nature of the current levels.


As for Grandpa, well, the Dow actually is just straight up so it's hard at this stage to measure the move.
This is a tricky point in the market. There is every possibility of a melt-up in my view and if so, it would be unfortunately to miss that by selling longs or adding too much in the way of short hedges. Equally those are huge short term extensions which one would expect would be sold, and quickly.
In staff personal accounts our answer to this has been to add very light hedges in each of the indices (see ratios long/short outlined below). As I have said many times, in this bull market I am nervous and impatient with shorts, relaxed and patient with longs.
Remember, if you want real-time trade alerts in index ETFs - long and short - join our Inner Circle service, here.
Let's Get To It
Paying members, scroll right down for our latest take on markets. As always we look at the 10-year yield, the S&P500, Nasdaq-100, Dow Jones and the Russell 2000; we add Bitcoin and Ether futures pricing for good measure.
Note - to open full-page versions of these charts, just click on the chart headings, which are hyperlinks.
US 10-Year Yield
Best guess the yield moves down, oscillating in the shorter degree within the bounds of that channel in the chart below.

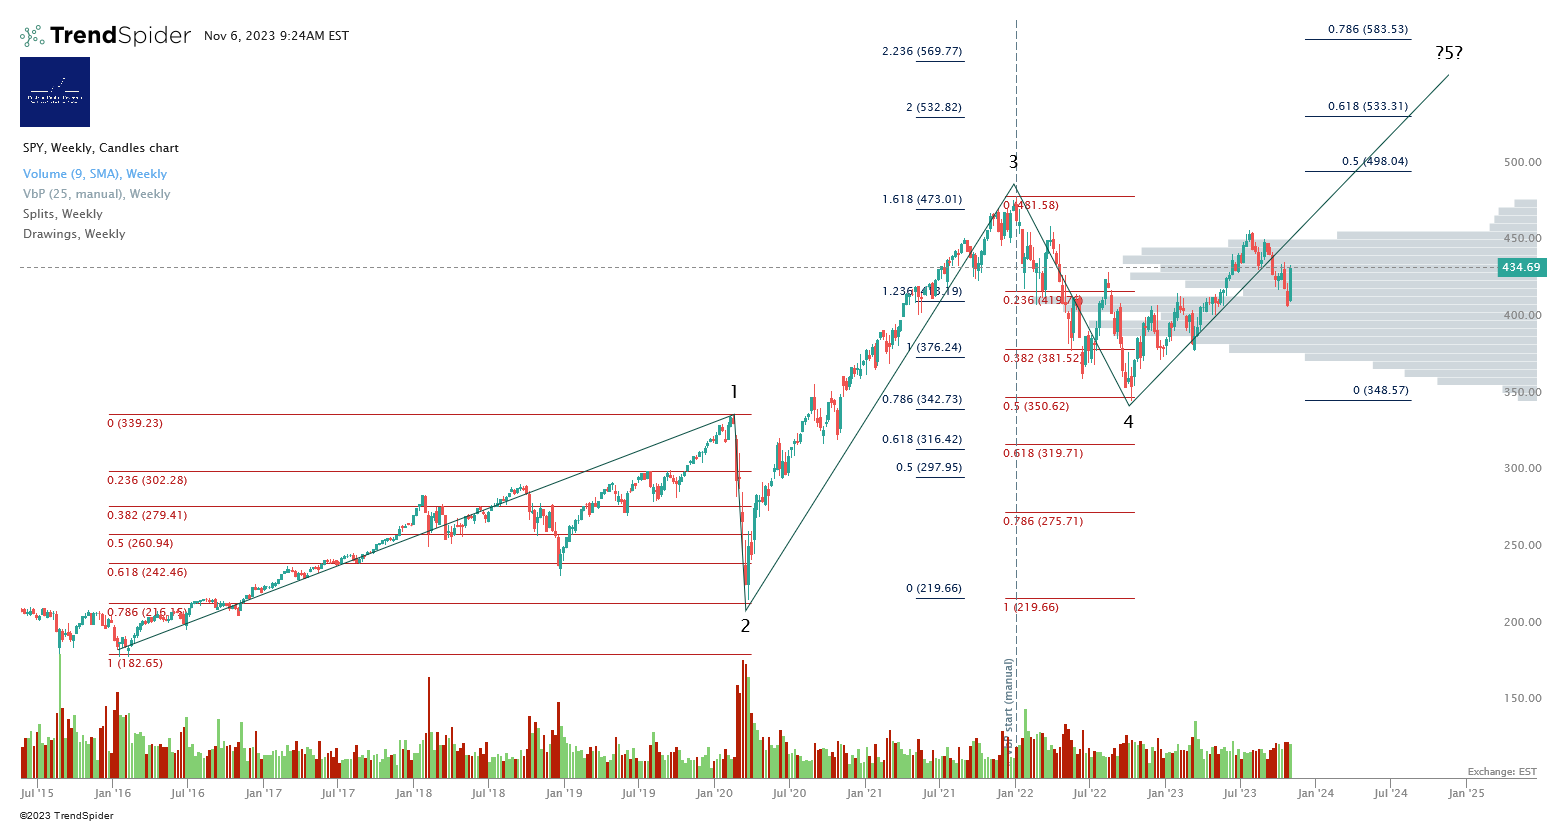
S&P500 / SPY / ES
Larger degree target, SPY480 - around the all time high.
Next, the Nasdaq.
Nasdaq-100 / QQQ / NQ
We are now tracking both our base- and bull cases in the QQQ.