


It Turns Out That Stocks Also Go Up
End Of World Delayed, For At Least A Day

DISCLAIMER: This note is intended for US recipients only and, in particular, is not directed at, nor intended to be relied upon by any UK recipients. Any information or analysis in this note is not an offer to sell or the solicitation of an offer to buy any securities. Nothing in this note is intended to be investment advice and nor should it be relied upon to make investment decisions. Cestrian Capital Research, Inc., its employees, agents or affiliates, including the author of this note, or related persons, may have a position in any stocks, security, or financial instrument referenced in this note. Any opinions, analyses, or probabilities expressed in this note are those of the author as of the note's date of publication and are subject to change without notice. Companies referenced in this note or their employees or affiliates may be customers of Cestrian Capital Research, Inc. Cestrian Capital Research, Inc. values both its independence and transparency and does not believe that this presents a material potential conflict of interest or impacts the content of its research or publications.
Something Strange And Unfamiliar Happened Yesterday
A peculiar green color permeated screens yesterday, a kind of Remembrance Of Things Past moment. In theory that could happen again today, but since two successive days of up seems too much positivity in the current environment, let's not jinx anything and instead just look to the charts as usual!
It's FOMC Wednesday and that usually brings with it not a little skulduggery, so even if today is an up-day, don't be surprised to see major games afoot tomorrow. Unless you are trading real-time, we believe a little separation from the live ticker to be helpful in resolving Powell-induced anxiety (a condition rumored to be forming part of the DSM-V when published).
Let's Get To It
Paying members, scroll right down for our latest take on markets. As always we look at the 10-year yield, the S&P500, Nasdaq-100, Dow Jones and the Russell 2000. We add Bitcoin and Ether futures pricing for good measure.
Note - to open full-page versions of these charts, just click on the chart headings, which are hyperlinks.
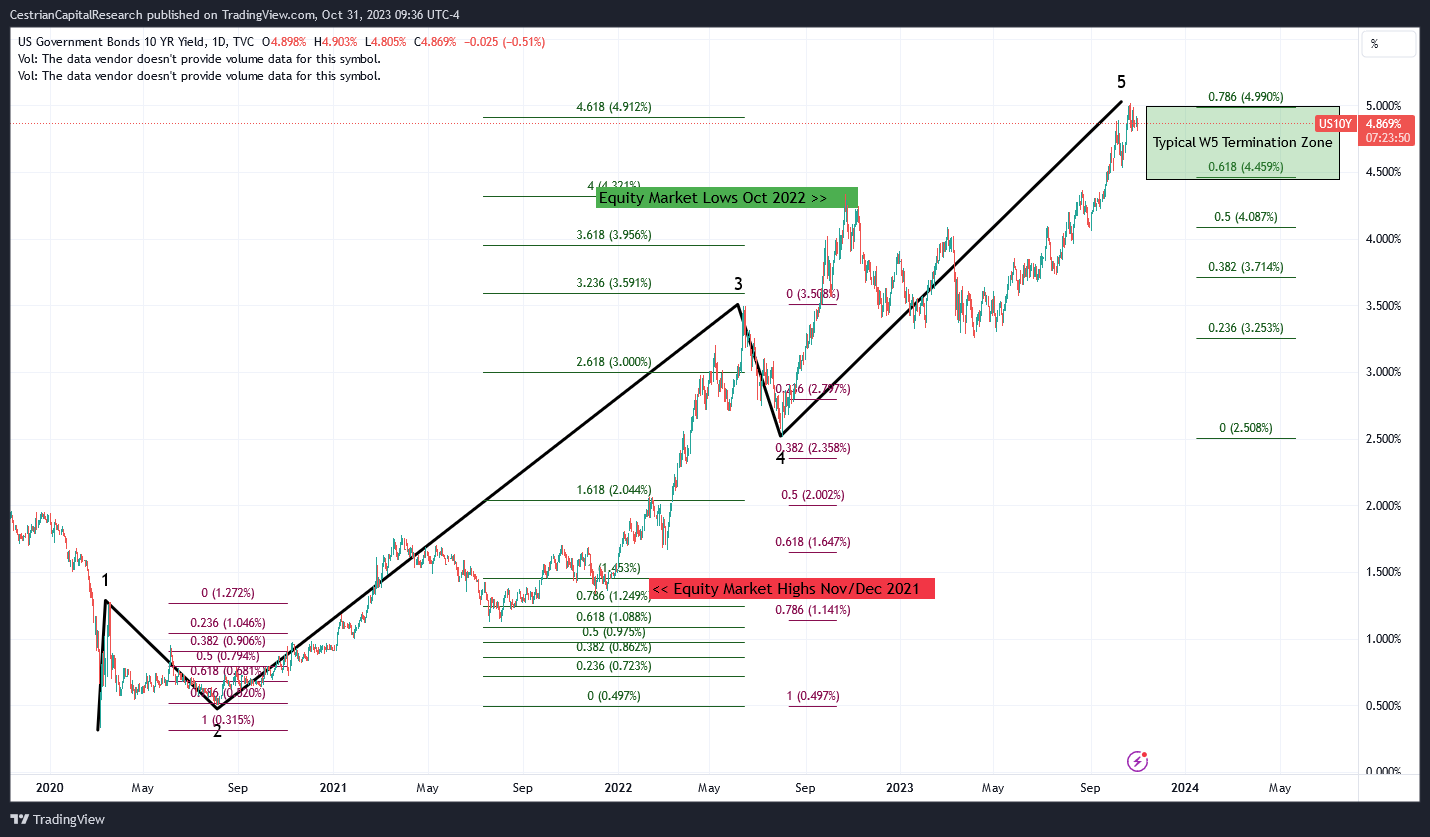
US 10-Year Yield
Continues to trend down we think.
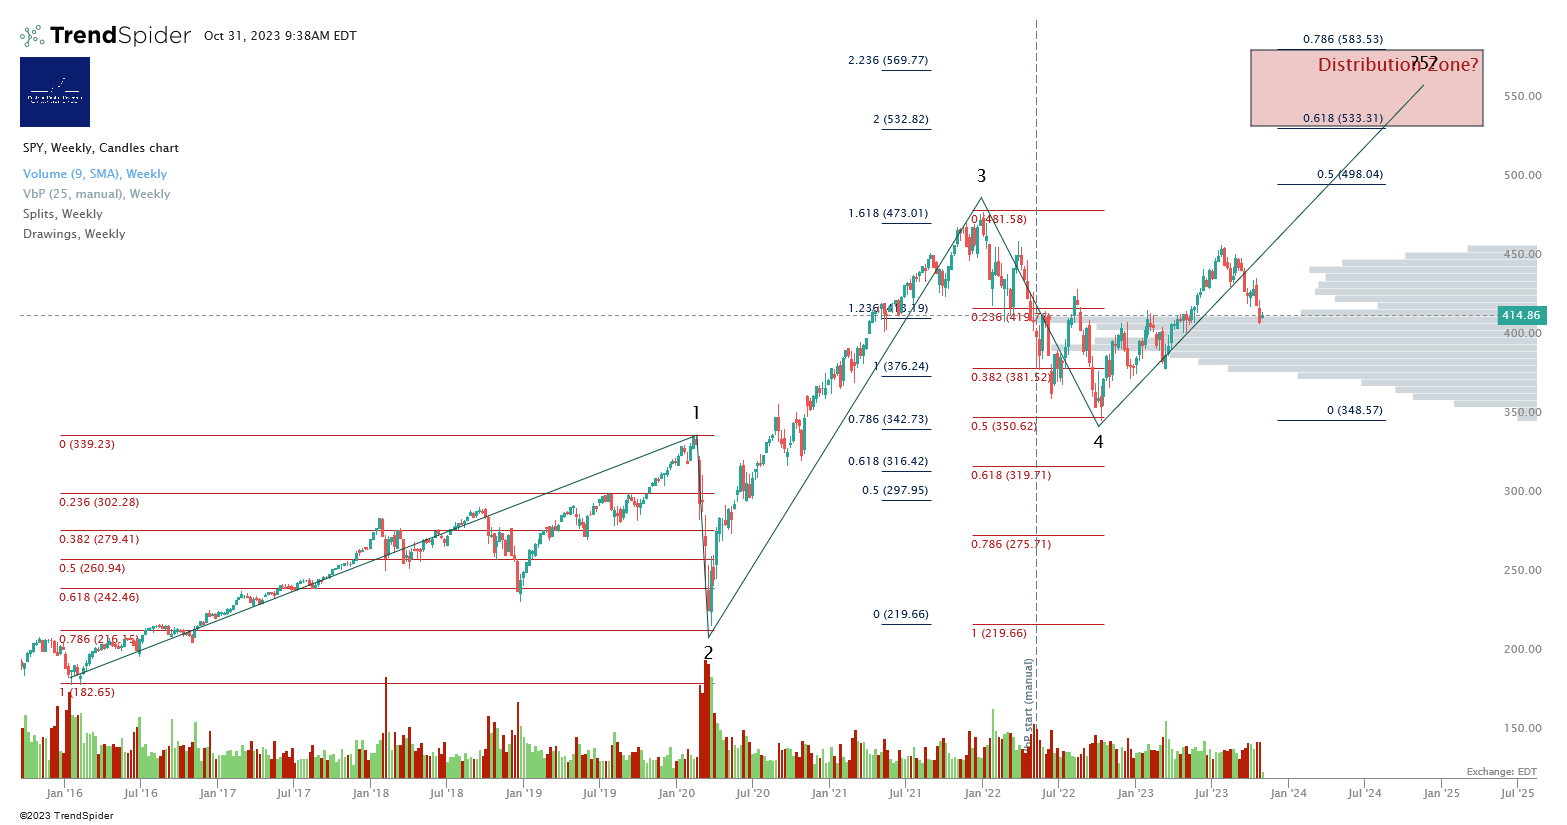
S&P500 / SPY / ES
Nasdaq-100 / QQQ / NQ
We are now tracking both our base- and bull cases in the QQQ.