Post CPI, Post FOMC Market Update
Hurricane Powell has yet to rip through the Nasdaq.

DISCLAIMER: This note is intended for US recipients only and, in particular, is not directed at, nor intended to be relied upon by any UK recipients. Any information or analysis in this note is not an offer to sell or the solicitation of an offer to buy any securities. Nothing in this note is intended to be investment advice and nor should it be relied upon to make investment decisions. Cestrian Capital Research, Inc., its employees, agents or affiliates, including the author of this note, or related persons, may have a position in any stocks, security, or financial instrument referenced in this note. Any opinions, analyses, or probabilities expressed in this note are those of the author as of the note's date of publication and are subject to change without notice. Companies referenced in this note or their employees or affiliates may be customers of Cestrian Capital Research, Inc. Cestrian Capital Research, Inc. values both its independence and transparency and does not believe that this presents a material potential conflict of interest or impacts the content of its research or publications.
What The Fed Is The Point Of These Charts?
The reason we post these charts every morning - well, almost every morning, there's little point in posting them on CPI or FOMC days before the event, the day before's charts are just fine for that purpose - is so you can use them in your own investing and trading work.
The larger-degree charts you can use to get set as to what is the longer-term (weeks, months) trend - up or down - and what is the countertrend - down or up. This is the course you can use to set your long-term investments. Nasdaq pointing up? Probably OK to own Microsoft and co. for the duration. Down? Probably not. Check to see what the Dow is doing to see if owning healthcare and industrials is a better idea in your retirement account.
The shorter-degree charts can be used for intraday or multi-day/week trading. If you are using the index ETFs or options or futures, you can use our charts to set your dominant side - long or short - as the long-term half of hedged pairs, and trade in and out of the countertrend side - short or long - to catch those countertrend moves. In staff personal accounts right now, our view is that the long term trend in the Nasdaq is, up - as you know from our larger degree chart pointing to a Wave 5 high making a new all time high. So we own $TQQQ on a long term basis and just hold it; when we think there's weakness ahead we open a simultaneous $SQQQ position to try to ride the downside, sell to take gains, then wait for the tide to lift $TQQQ once more. We never execute perfectly of course but as a trading plan this works well for us.
These things take a good deal of time each day to produce, and they’re the self same charts we use in our own personal account investing and trading. So they live behind the paywall, we think that’s fair.
Today however we include the S&P500 longer- and shorter-term charts before the paywall break, so everyone can see what they provide.
If you’re a free subscriber here and want to receive these charts daily, just sign up to our low-cost Premium membership once you hit the paywall. You’ll get the S&P, the Nasdaq, the Dow and the Russell each time.
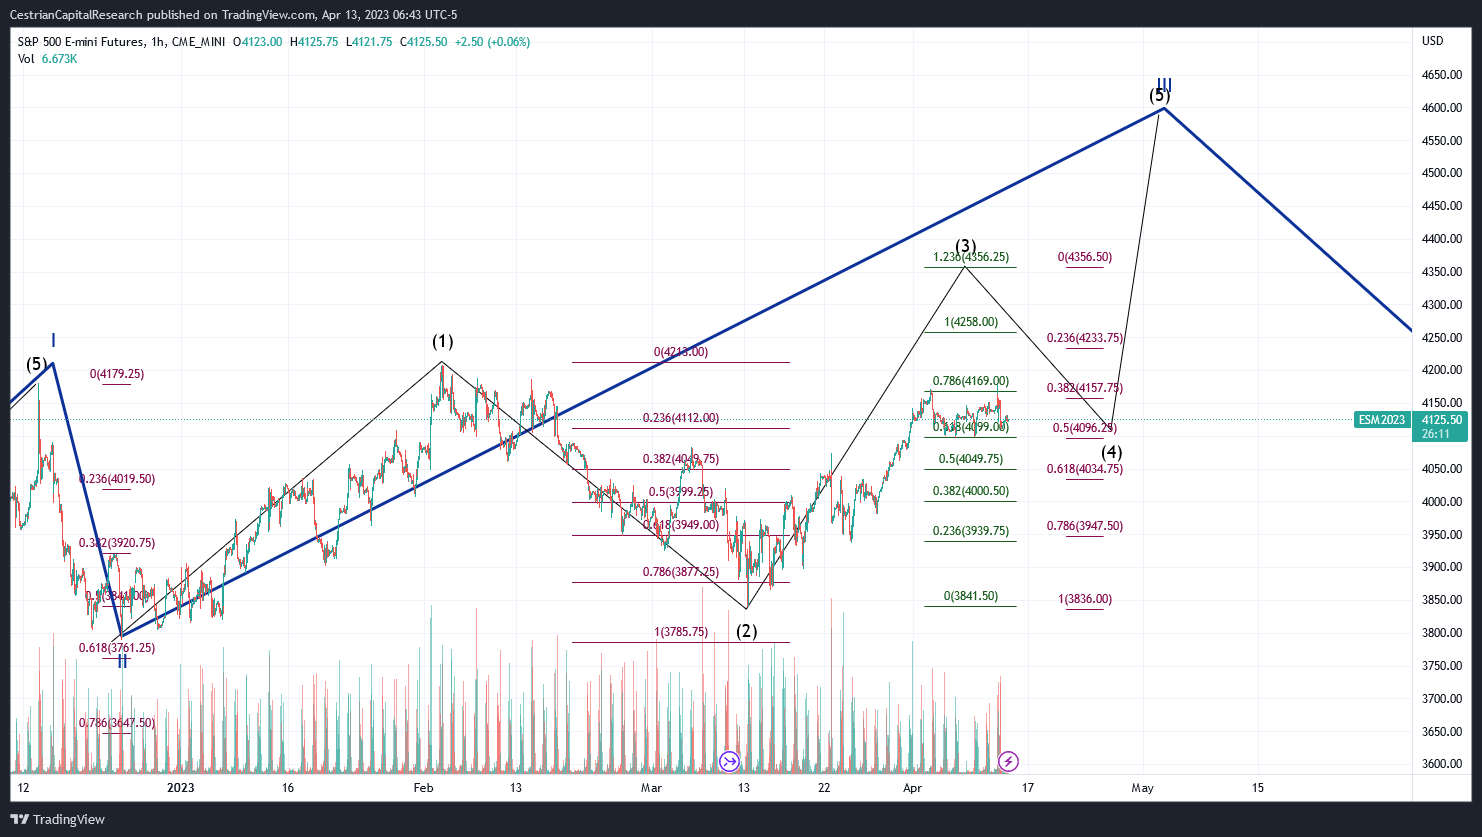
S&P500 / SPY / ES
$418 remains the hurdle to vault.

4099 has to hold as support in ES if the index is to keep moving up; 4169 remains upside resistance.
By the way - the reason we use the futures chart for the smaller degree is that futures trade almost 24/7, so over shorter timeframes we get a lot more price information than if we used the ETFs.