


That Pre-Millenium Tension Feeling
Or in other words, Will The Nasdaq Correct, Or Not?

DISCLAIMER: This note is intended for US recipients only and, in particular, is not directed at, nor intended to be relied upon by any UK recipients. Any information or analysis in this note is not an offer to sell or the solicitation of an offer to buy any securities. Nothing in this note is intended to be investment advice and nor should it be relied upon to make investment decisions. Cestrian Capital Research, Inc., its employees, agents or affiliates, including the author of this note, or related persons, may have a position in any stocks, security, or financial instrument referenced in this note. Any opinions, analyses, or probabilities expressed in this note are those of the author as of the note's date of publication and are subject to change without notice. Companies referenced in this note or their employees or affiliates may be customers of Cestrian Capital Research, Inc. Cestrian Capital Research, Inc. values both its independence and transparency and does not believe that this presents a material potential conflict of interest or impacts the content of its research or publications.
Feeling Twitchy Yet?
We will know soon enough whether animal spirits are back and the Nasdaq will moon, led by the indefatigable $NVDA (stock going straight up even as earnings go straight down, thankyou AI mania!) - or whether the usual rules of gravity apply and we get a corrective reset in the index before the next move higher.
With that in mind we move on to our usual daily charts. Don’t forget that if you want a full note every day before the open which includes not just the equity indices but also the US 10-year yield and Bitoin / Ether futures data, you should sign up for our Cestrian Inner Circle service. You can learn more about it by clicking this link.
S&P500 / SPY / ES
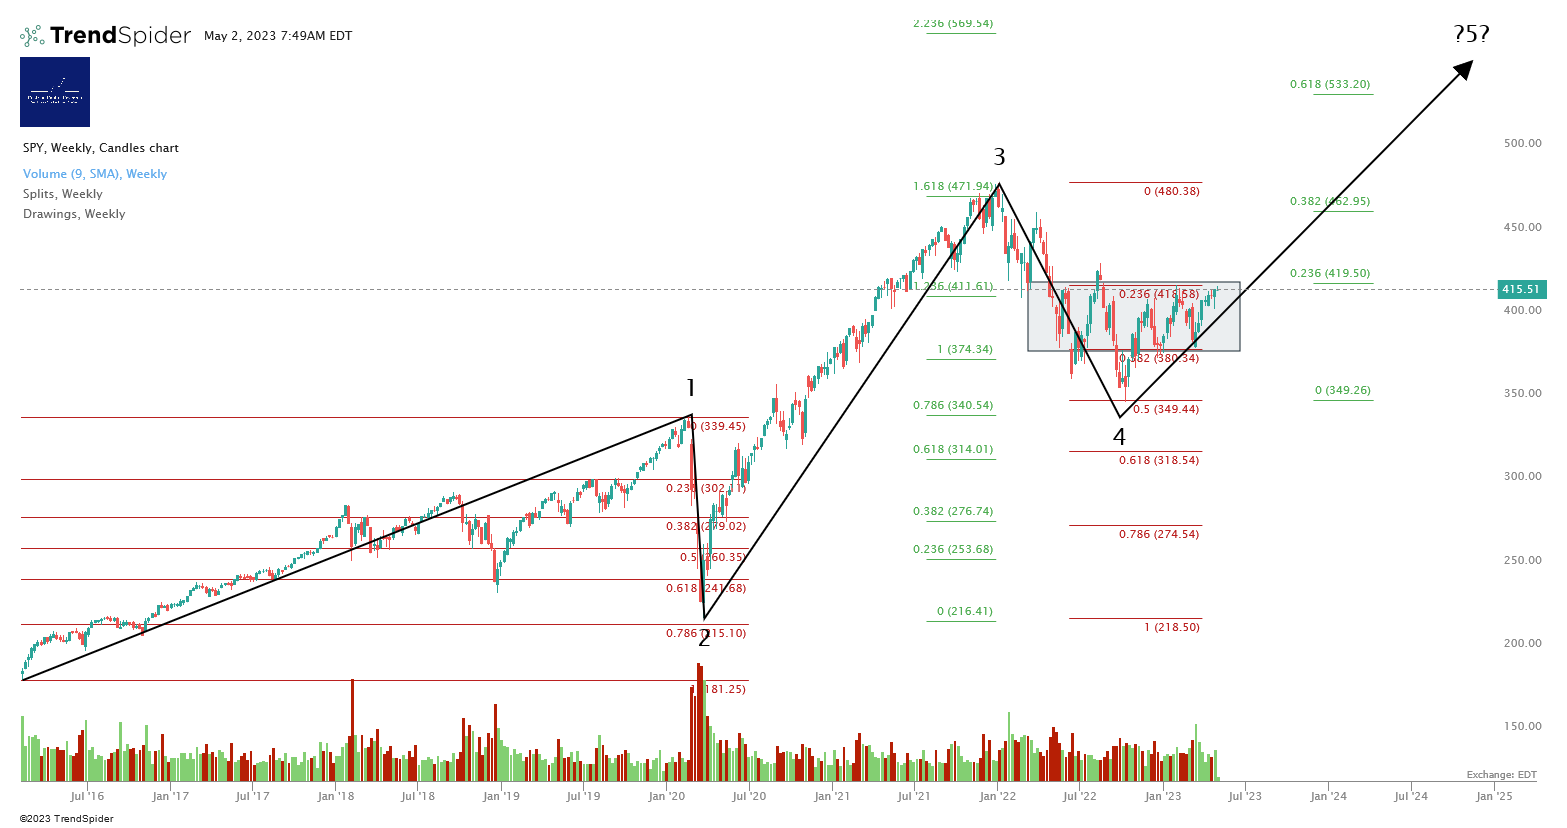
The triple top is strong resistance, until it isn't. If the ES pushes up and over that red line around 4210, and turns it into support, then the next leg up in the S&P has begun.
